ms

Mass spectrometry

Mass spectrometry (MS) is an analytical technique that ionizes chemical species and sorts the ions based on their mass-to-charge ratio. In simpler terms, a mass spectrum measures the masses within a sample. Mass spectrometry is used in many different fields and is applied to pure samples as well as complex mixtures.

We invented a new de-convolution method to do mass spectrometry, our library could be used in your software for real-time discovering components spectrum. The following 4 figures are made by our software and will show you how advance our algorithm is.

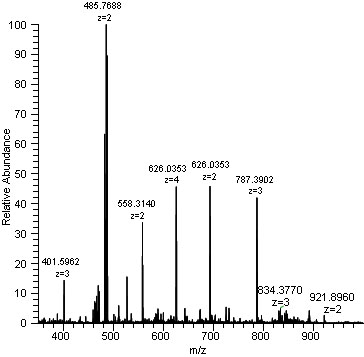
The example of de-convolution method

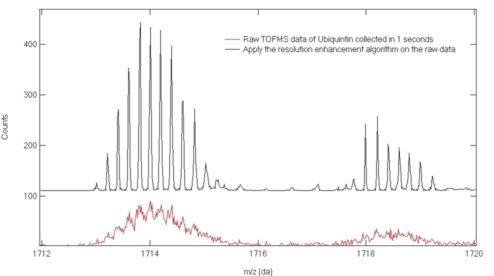
The bottom red curve is the original data from the mass spectrometer. The top black curve is the result using our de-convolution algorithm.

mass_spectr_2


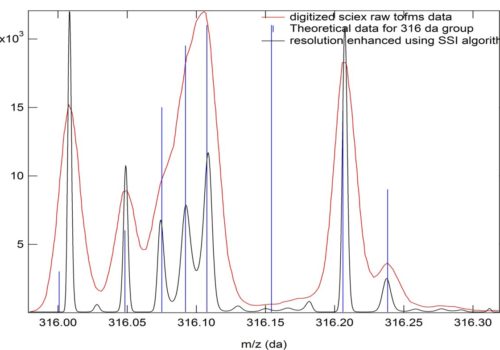
  • For a well averaged raw data, our algorithm could greatly improve the SNR.
mass_spectr_5
mass_spectr_1
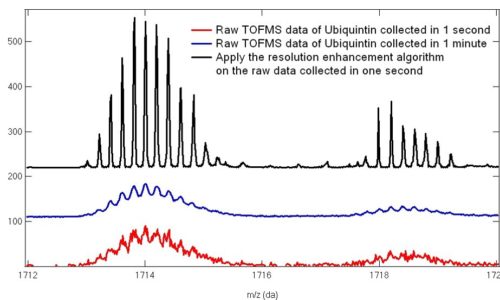
  • The red curve is the original data.
  • The blue curve is the average value for 1 minute of the original data (red curve), normally mass spectrometer has to wait for a while to get a averaged value.
  • The black curve is the result using our algorithm, no need to wait for a minute, the result is produced instantaneously with the original data.

It is very important to get the instantaneous mass spectroscopy result as some components may decay very soon.

mass_spectr_3
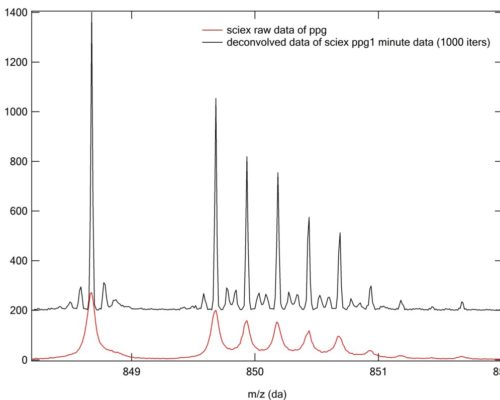
  • An example for a calibration data

Our algorithm is not limited for the application of mass spectrometry, many other fields, for example, image processing, spectral analysis, could use our algorithm to get fast and enhanced results. Please see the following video for a demonstration.